Charts are used to illustrate certain information about a company with figures and graphs: whether or not it has evolved, results by year, etc...
How to create a chart ?
Structure > Block Layout > Add custom block > Chart
1. Add a title (only visible in Back-Office)
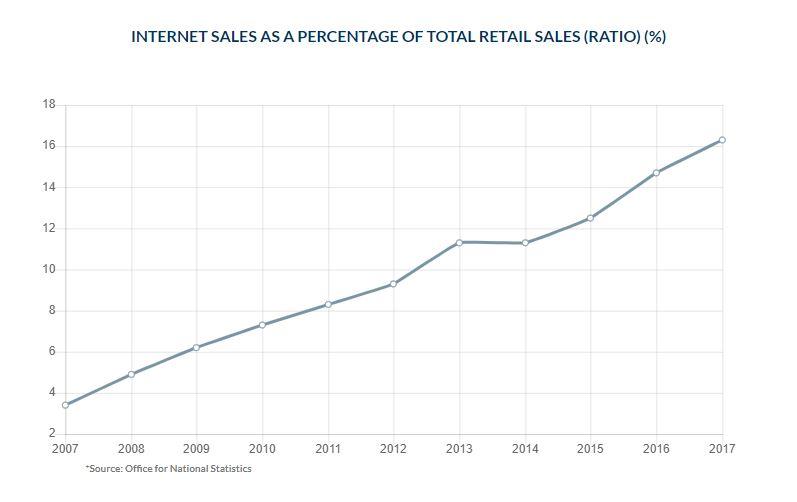
2. Choose the type of Chart you want:
- Line
- Bar
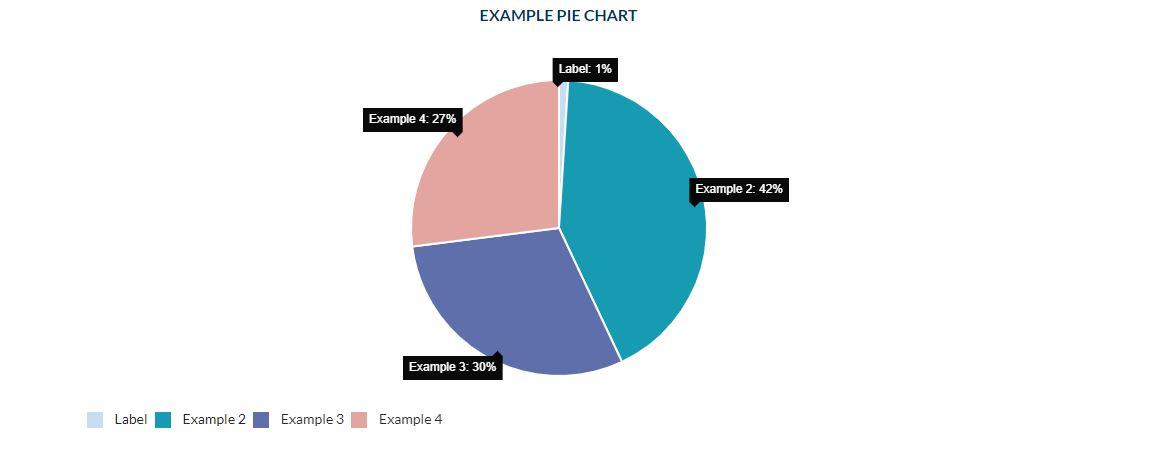
- Pie
- Doughnut
3. Options can be selected to illustrate the figures as fully as possible.
- Percentage: Indicate chart values in percentages.
- Display Title: Indicate chart title
- Display chart captions
- Display Tooltips
4. The Footnote is available if you want to add a legend to your chart.
5. Choose the background color for your chart.
Two colors are available: white and beige.
Gradient color : Add a colour gradient to your chart
6. In Horizontal Axis Option, add the elements (numbers, charts...) you want to highlight.
You can add several using the "Add Another Item" option.
7. Dataset: Add data to your chart.
You can change colors by dataset.